So far we have looked at vector graphics. Now, we will move on to raster graphics.
In Chunk 21, we defined a pixel as the smallest unit of a digital (raster-based) image and in Chunk 22, we introduced the vector and raster image graphics formats and the common differences between them. In this section, we will focus on specific differences in precision, shape rendering and file size and why they may influence your choice of image graphics format. We will then define the image bitmap format and see how we can construct raster images pixel by pixel using colour gradients as an example.
Precision
The following discussion on precision is a bit technical. Please bear with this because as you will see in one of the examples we use later, precision can be a factor when choosing between raster and vector graphics for your Computer Art.
So, how is precision defined in vector graphics?
Most computers these days have a 32-bit binary word length. In base 10, 232 is equivalent to 4,294,967,294 or around 4.3 billion [1]. In practice, we need to distinguish between positive and negative numbers (1 binary bit is reserved to do this). We also want the flexibility to define very large or very small numbers and we use floating point numbers to do this. Let's look at an example coordinate:
1234.567 = 0.1234567   x   104
                      mantissa         exponent
On a 32-bit computer, the single precision binary floating point format uses a (23:8) mantissa:exponent allocation which gives a floating point range with bias of 2127 to 2-126 [2] and an implicit precision of log10 (224) ≈ 7.225 i.e. around 7 decimal places [3]. Consequently, the above coordinate could be accommodated on our 32-bit computer.
But what happens if we need to perform operations with a coordinate stated to 7 decimal places? For example, in [4:85], the distance between two points a and b in Euclidean space whose coordinates are xa,ya and xb,yb is given by the Pythagorean derived formula of:
½ab½ = √ (xb – xa)2 + (yb - ya)2
This involves calculating the square of the above coordinate i.e.
1234.5672 = 1,524,155.677489
But when we do this on our single precision binary floating point 32-bit computer, we get approximately:
1,524,155 or 0.1524155 x 10⁷
So what happened to the remaining mantissa digits? Well, (assuming our computer does not have an extended chipset architecture for maths operations) the computer's 24-bit mantissa length was exceeded so it truncated the result to what it could store . Therefore, if we want to maintain absolute precision with vector graphics, we cannot express coordinates whose mantissa/exponent values exceed their respective bit allocations or where the result of an operation on them would exceed these allocations. But if we are prepared to accept some loss of precision then we have a massive number range at our disposal.
Now, let's look at how precision is defined for Raster graphics. Once more, the binary bit word length is the prime constraint. So, theoretically, a 32-bit computer ought to be able to display an image with 4.3 billion pixels. Practically, we also need to consider colour depth and a suitable memory buffer size for image manipulation. Colour depth can range from simple 1 bit black/white to 48 bit RGB (Table 1).

Table 1
One final constraint on precision is that these upper limits will be further reduced if the 32-bit computer's physical random accessible memory (RAM) size is lower than its maximum addressable memory size. For example, a 32-bit computer equipped with 1 gigabit of RAM would support a maximum raster image size of around 2,700 x 2,700 pixels.
Now, we will look at how easily shapes are rendered for vector and raster images.
In chunks 22 to 25, we saw with vector graphics how easy it is to create complex images from points, lines and curves defined to a high precision. In raster graphics, we create images by manipulating the color values of individual pixels. To create complex images, this potentially requires an enormous number of operations. However, as we will see in the colour gradient examples discussed later, we can facilitate things by repeating the same process over a defined area of an image.
File size
The third important difference between the two graphics formats is file size. Generally, file size is much smaller for vector graphics. For example, in Chunk 22, we saw how vector graphics can easily create images of any size simply by defining an appropriate set of coordinates. By contrast, a raster image's size is determined by the number of and size of its constituent pixels. Generally, for a similar image size, the raw vector image file size will be much smaller than the corresponding raw raster image unless the image is particularly complex or the constituent pixel size is particularly large. Of course data compression, as discussed in Chunk 76, may limit this difference.
Bitmap image
A popular raw raster image file format is the bitmap (*.bmp) where pixels are stored in rows [6]. This simple file format facilitates recording and manipulation of individual pixel values.

Figure 1 - 2x2 Pixel Bitmap, with 24 bits/pixel encoding (image courtesy of Wikipedia [6])
 Table 2 - (from Wikipedia example -see [6])
The size of the bitmap is specified at Offset 2 which is the sum of the bytes listed in the Size column. Offset 10 indicates that pixel values are specified starting at Offset 54. Generally, raster file size is defined as:
height x width x color depth
In our Figure 1 example, this would give:
2 x 2 x 3 bytes (see Table 1, 24-bit RGB) = 12 bytes
In fact, this is the sum of the Size values for Offsets 54, 57, 62 & 65 in Table 2.
Creating raster images with color gradients
So far in the book, we have created images taking a vector graphics approach. Now, we will see how to construct images with raster graphics by manipulating values of individual pixels. For this purpose, we will experiment with colour gradients starting with a simple linear progression before moving on to some more complex designs. In Chunk 72, we looked at the HSB and RGB colour modes. We will use the RGB mode in this section due to its wider colour range.
//Example1
//Author: Marshall J. Heap
//Date: January 14, 2009

void setup()
{
  size(300, 100);//Screen width and height
  background(175);
  smooth();
  createGradient();
}

void createGradient()
{
float px = 0, py = height/2; //Column px, Row py
int v=0;

for (v=0; v<
256; v++) {
    px++;
     color c = color(int(255), int(v), int(0));//RGB values
      set(int(px), int(py), c);// Pixel coordinates and value
  }
}
Figure 2 - Processing code for simple linear colour gradient (Example 1) Figure 3 - Output of simple linear one pixel wide colour gradient
In our second example, we will construct a series of concentric rings each of a different colour that cover the range of the visible colour spectrum. This presents a series of challenges. First, we need to express the range of the colour spectrum in RGB color mode. Table 3 is our resource for this.
 Table 3
In the five if statements shown in the code below (Figure 4), color c progressively changes from red to violet following the five bands in Table 3.
//Example2
//Author: Marshall J. Heap
//Date: January 14, 2009

void setup()
{
  size(255, 255);
  background(255,255,255);
  smooth();

int radius = width/2;
int normalize = ((255/(radius))*5);//displays over spectrum range
createGradient(radius, normalize);
} //close setup()

void createGradient(int radius, int normalize )
{
float px = 0, py = 0, angle = 0;
float pixelLocator = 8.0;//stops gaps appearing
color c = color(int(255), int(0), int(0));

for (int i=0; i<radius; i++) {
   for (float j=0; j<360; j+=1.0/pixelLocator) {
    px = radius+cos(radians(angle))*i;
    py = radius+sin(radians(angle))*i;
    angle+=1.0/pixelLocator;

    if(i<radius/5) {//conditional statements for each of the 5 spectral bands
      c = color(int(255), int(0+normalize*i), int(0));
      }
    if(i>radius/5 && i<(2*radius/5)) {
      int adj = radius/5;//offset to restore count value to 1 for band
      c = color(int(255-((i-adj)*normalize)), int(255), int(0));
      }
    if(i>(2*radius/5) && i<(3*radius/5)) {
      int adj = int(2*radius/5);
      c = color(int(0), int(255), int(0+((i-adj)*normalize)));
      }
     if(i>(3*radius/5) && i<(4*radius/5)) {
      int adj = int(3*radius/5);
      c = color(int(0), int(255-((i-adj)*normalize)), int(255));
      }
    if(i>(4*radius/5) && i<radius) {
      int adj = int(4*radius/5);
      c = color(int(0+((i-adj)*normalize)), int(0), int(255));
      }
   set(int(px), int(py), c);
  }
 }
//Smoothen boundary
//noFill();
//strokeWeight(3);
//stroke(int(255),int(0),int(255));
//ellipse(radius,radius,width-3,height-3);
}
Figure 4 - Processing code for radial colour spectrum gradient (Example 2)
Radial progression is defined by the first for loop and perimetral progression is defined using a trigonometric expression in the second for loop. The pixelLocator variable is based on Ira Greenberg's gapFiller solution to the problem of gaps that otherwise appear in the radial gradient [7:428]. Figure 5a illustrates what happens when the pixelLocator value is reduced to 4.0. Earlier we discussed digit loss when the mantissa exceeds our computer's 32-bit word length. This can happen here when coordinate float values are determined e.g.:
float px = radius+cos(radians(angle))*i
However, even more precision loss is introduced when the float is converted to an integer by the set() method. Here all the decimals are lost. The task is to locate all the pixels occurring within each degree of arc. This value will increase with radius. In our Example 2, the maximum value is calculated as follows:
2Πr/360 degrees = (2 x 22/7 x 127)/360 ≈ 2.2 pixels
Therefore, in the first for loop, we need to move in sufficiently small increments to capture all possible px/py integer coordinates within each degree of arc. In practice, a pixelLocator value of 22 is good for radii up to 108 pixels and a value of 23 is good for radii up to 232 pixels. Use of intermediate decimal values causes precision loss which is easily observed by the appearance of gaps (see Figure 5b with a pixelLocator value of 15). It is possible that pixelLocator values that are powers of 2 lead to greater precision because they are binary numbers.


Figure 5a - Output (pixelLocator value 4). Figure 5b - Output (pixelLocator value 15).


Figure 5c - Output excluding Smoothen boundary. Figure 5d - Output including Smoothen boundary
The normalize variable ensures regular sampling of the colours available in the respective colour band and the adj variable, that appears in the last four if statements, resets the i counter to 1 for these colour bands.
The final point on Example 2, concerns the commented out Smoothen boundary code. Running this code as is gives the result in Figure 5c where an attentive examination reveals a somewhat jagged perimeter. The explanation is due to the precision limit available to the raster graphics model used here where spatial resolution is limited to the number of pixels per unit area. The Smoothen boundary code used to ameliorate this phenomenon (see Figure 5d) makes recourse to the vector graphics model.
In our third and last example, we will attempt to use colour gradients to create some artistic designs.
//Example3
//Author: Marshall J. Heap
//Date: January 20, 2009

void setup()
{
  size(510, 510);
  smooth();

int j = 0; //publicly accessible counter
int[] x = {0,1,2,3};//setGradient case values
//randomly & progressively select all case values
 for (int i=0; i<=x.length; i++) {
   int index = int(random(5));//random colorBand
int wedgeChoice = int(random(x.length));
int choice = x[wedgeChoice];
setGradient(choice, j, index);
//Ensures each wedge randomly selected without duplication
x = removeArrayElement(choice, x);
}
}

void setGradient(int choice, int j, int index)
{
float px = 0, py = 0;
switch(choice) {
case 0:                       //***
for (int i=0; i<=width; i++) {// **
    px++;                     //  *
    py = 0;
for (j=0; j<=i; j++) {
      py++;
      color c = setColor(j, index);
      set(int(px), int(py), c);
  }
}
break;
case 1:                       //*
for (int i=0; i<=width; i++) {//**
    py++;                     //***
    px = 0;
for (j=0; j<=i; j++) {
      px++;
      color c = setColor(j, index);
      set(int(px), int(py), c);
  }
}
break;
case 2:                       //  *
for (int i=width; i>=0; i--) {// **
    py++;                     //***
    px = width;
for (j=0; j<=width-i; j++) {
      px--;
      color c = setColor(j, index);
      set(int(px), int(py), c);
  }
}
break;
case 3:                       //***
for (int i=0; i<=width; i++) {//**
    px++;                     //*
    py = 0;
for (j=0; j<=width-i; j++) {
      py++;
      color c = setColor(j, index);
      set(int(px), int(py), c);
  }
}
break;
}
}

color setColor(int j, int index) {
color c1 = color(int(255), int(j), int(0));
color c2 = color(int(j), int(255), int(0));
color c3 = color(int(0), int(255), int(j));
color c4 = color(int(0), int(j), int(255));
color c5 = color(int(j), int(0), int(255));
color[] colors = {c1,c2,c3,c4,c5};
color colorBand = color(colors[index]);
return colorBand;
}

int[] removeArrayElement(int n, int[] oldArray){
   int[] newArray = new int[oldArray.length-1];
   int newIndex = 0;
   for (int oldIndex=0; oldIndex<oldArray.length; oldIndex++)
      if (oldArray[oldIndex] != n)
            {
                newArray[newIndex] = oldArray[oldIndex];
                newIndex++;
            }
   return newArray;
}
Figure 6 - Processing code for randomly combined wedge colour gradients (Example 3) 

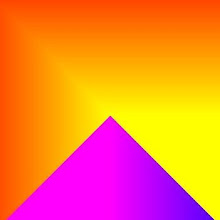
Figure 7a - 2 visible wedges. Figure 7b - 3 visible wedges.


Figure 7c - 3 visible wedges. Figure 7d - 3 visible wedges.
Figures 7a to 7d illustrate some of the random designs produced by the program. In each design, either two or three of the four wedges are visible and this depends on the order in which they were drawn.
Summary
To summarize, we have seen that in creating images, the rich color palette available and the ease with which a single pixel colour value can be set is a strength of raster graphics. However, where shape complexity, precision or file size are important, the vector graphics model is superior. Still, with the advent of double precision floating point numbers in 64-bit computing, the raster graphics model will soon be able to offer sufficient precision on 64-bit computers equipped with a suitable amount of RAM. However, one area where the raster graphics model has net superiority is in its ability to host captured digital images which we will be discussing in Chunk 76.
REFERENCES
[1] Wise, S. (2002). GIS Basics. CRC Press.
[2] IEEE_754-1985. (2008). In Wikipedia, The Free Encyclopedia.
Retrieved January 22, 2009, from http://en.wikipedia.org/wiki/IEEE_754-1985
[3] Single Precision. (2009). In Wikipedia, The Free Encyclopedia.
Retrieved January 22, 2009, from http://en.wikipedia.org/wiki/Single_precision
[4] Worboys M. & Duckham M. (2004) GIS – A Computing Perspective.
USA: CRC Press LLC. (2nd Edition).
[5] Aspect Ratios and their relationship to print size. (2008). In, NW
World Wide Web. Retrieved January 22, 2009, from http://nwwww.com/printing.htm
[6] BMP file format. (2009). In Wikipedia, The Free Encyclopedia.
Retrieved January 22, 2009, from http://en.wikipedia.org/wiki/Windows_bitmap
[7] Greenberg, I. (2007). Processing: Creative coding and Computational Art.
friendsofed.